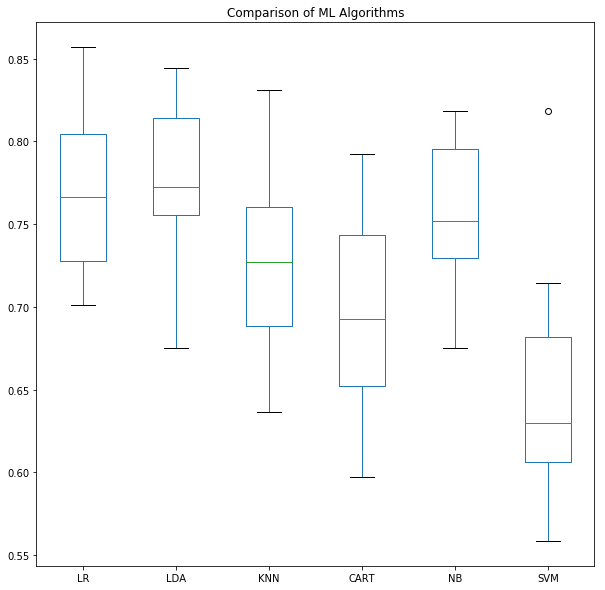
It is important to compare the performance of different Machine Learning algorithms.
In this example, we will create a test harness to compare different algorithms on the classification problem dataset (Pima Indians diabetes).
Algorithms included:
1. Logistic Regression (linear)
2. Linear Discriminant Analysis (linear)
3. k-Nearest Neighbors (non-linear)
4. Classification and Regression Trees (non-linear)
5. Naive Bayes (non-linear)
6. Support Vector Machines (non-linear)
This recipe includes the following topics:
- Load classification problem dataset (Pima Indians) from github
- Create a test harness for evaluating the performance of multiple algorithms on the dataset
- Visualize the results for comparison
# import modules
import pandas as pd
import matplotlib.pyplot as plt
from sklearn.model_selection import KFold
from sklearn.model_selection import cross_val_score
from sklearn.linear_model import LogisticRegression
from sklearn.discriminant_analysis import LinearDiscriminantAnalysis
from sklearn.neighbors import KNeighborsClassifier
from sklearn.tree import DecisionTreeClassifier
from sklearn.naive_bayes import GaussianNB
from sklearn.svm import SVC

# read data file from github
# dataframe: pimaDf
gitFileURL = 'https://raw.githubusercontent.com/andrewgurung/data-repository/master/pima-indians-diabetes.data.csv'
cols = ['preg', 'plas', 'pres', 'skin', 'test', 'mass', 'pedi', 'age', 'class']
pimaDf = pd.read_csv(gitFileURL, names = cols)

# convert into numpy array for scikit-learn
pimaArr = pimaDf.values

# Let's split columns into the usual feature columns(X) and target column(Y)
# Y represents the target 'class' column whose value is either '0' or '1'
X = pimaArr[:, 0:8]
Y = pimaArr[:, 8]

# set k-fold count
folds = 10

# set seed to reproduce the same random data each time
seed = 7

# set evaluation metric to 'accuracy' for classification accuracy
scoring='accuracy'

# initialize machine learning algorithms
# and store them as tuples (name, model)
models = []
models.append(('LR', LogisticRegression()))
models.append(('LDA', LinearDiscriminantAnalysis()))
models.append(('KNN', KNeighborsClassifier()))
models.append(('CART', DecisionTreeClassifier()))
models.append(('NB', GaussianNB()))
models.append(('SVM', SVC()))

# cvScoresDf: DataFrame of cv scores
# index of DataFrame is the name of the model
cvScoresDF = pd.DataFrame()

# loop through each model and evaluate each model
for name, model in models:
    # split data using KFold
    kfold = KFold(n_splits=folds, random_state=seed)

    # call cross_val_score() to run cross validation
    cvScores = cross_val_score(model, X, Y, cv=kfold, scoring=scoring)

    # add column data to dataFrame
    cvScoresDF[name] = cvScores

    # calculate mean of scores for all folds
    meanAccuracy = cvScores.mean()

    # calculate standard deviation of scores for all folds
    stdAccuracy = cvScores.std()

    # print mean and std for each model
    print("%s: %.5f (%.5f)" % (name, meanAccuracy, stdAccuracy))

# Visualize the results for comparison using boxplot
cvScoresDF.plot.box(subplots=False, figsize=(10,10), sharey=True)

plt.title('Comparison of ML Algorithms')
plt.show()
LR: 0.76951 (0.04841)
LDA: 0.77346 (0.05159)
KNN: 0.72656 (0.06182)
CART: 0.69653 (0.05856)
NB: 0.75518 (0.04277)
SVM: 0.65103 (0.07214)

