Trading is a game of probabilities. Thinking in terms of probabilities and not ‘right and wrong’ is perhaps the most important mindset shift.
This note includes the following topics:
- Thinking in Probabilities
- The Casino Paradigm
- The Expectancy
- Win Rate VS Profit-to-Loss Ratio
Thinking in Probabilities
- No one has the certainty to predict the future. It’s like asking what the next coin flip will be.
- None of the following entities can predict the future. AVOID seeking the next HOT stock tip.
- Nobel Prize-Winning Economist
- Financial Experts
- Newsletters
- CEO
- CNBC
Question: If nothing is predictable, how can we make money trading?
– Probability. With an EDGE (probabilistic advantage), you will always win in the long run.
The Casino Paradigm
- The Casino industry is built around the concept of probability.
- Take a Roulette game, where the outcome of the next spin is random. But the casino/house is still profitable.
- Why does the house win?
- The outcome of 10,000 spins is less random
- Betting on Red Or Black
- Probability of House Winning: 52.6% [EDGE]
- Probability of You Winning: 47.4%
- The outcome of 1 spin/trade is random. But if you have an EDGE, you will make money after many trades.
- No Edge, No Trading!!
The Expectancy
- Expectancy: How much money can I make per trade?
- Three key elements
- Win Rate a.k.a Batting Average: Number of profitable trades / Total number of trades
- Average Profit: Total profit / Number profitable trades
- Average Loss: Total loss / Number of unprofitable trades
- Use case
- If your expectancy is $100 and your total trades in a year is 150.
- You can estimate your yearly profit to be $15,000.
Expectancy = (Win Rate x Avg Profit) - (Loss Rate x Avg Loss)

Sample:
Win Rate: 40%
Avg Profit: $1,000
Avg Loss: -$500

Expectancy == (40% * $1,000) - (60% * $500) = $100
i.e. You can expect to make $100 per trade over the long run.
Will you make $100 in every trade?
- No. In fact, 60% of your trade will be a loss.
- But you will still make an average of $100 per trade if you stick long enough with your plan.
Win Rate VS Profit-to-Loss Ratio
- Win Rate a.k.a Batting Average: Number of profitable trades / Total number of trades
- Profit-to-Loss Ratio: Average Profit / Average Loss
- a.k.a Payoff Ratio or Avg Risk/Reward
## Best trading strategies have
  - High Profit-to-Loss Ratio: >3
  - Respectable Win Rate: >40% to 50%
HIGH Win Rate + LOW Profit-to-Loss Ratio
- Psychologically easy to trade since you win often. Hence attracts more people who can’t think in probabilities.
- But less robust since you do NOT have direct control over the market or win-rate when the market changes.
HIGH Profit-to-Loss Ratio + LOW Win Rate
- More forgiving. With a Profit-to-Loss ratio of 3, you can be wrong 7 out of 10 times and still make money.
- Difficult to trade when losing streak occurs. Must be able to think in terms of probability and NOT certainty
Profit-to-Loss Ratio = Average Profit / Average Loss

Sample:
Avg Profit: $1,000
Avg Loss: -$500

Profit-to-Loss Ratio == $1,000 / $500 = 2:1
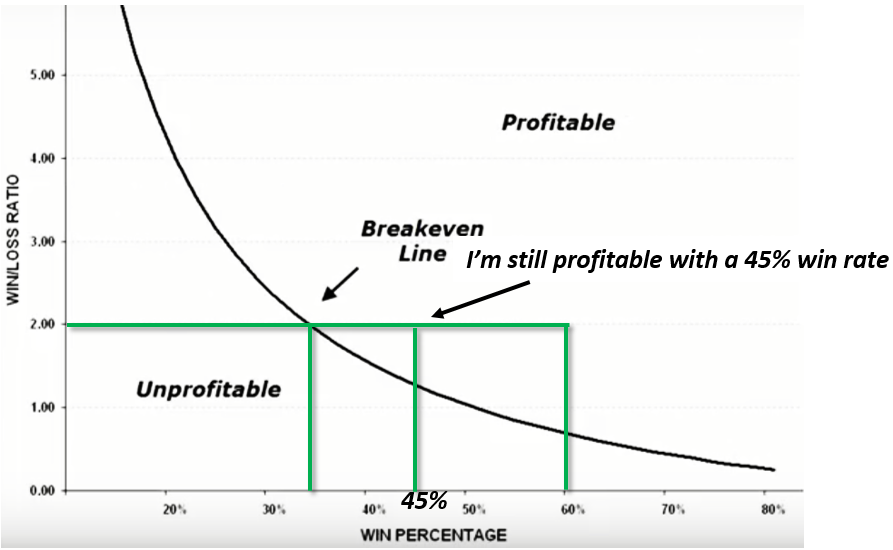
Breakeven Chart

- With a Profit-to-Loss Ratio of 2:1
- Break-even: Even if you are correct only 35% (win-rate) of the time, you can still break even. i.e You can be wrong 65% of the time and still be break-even.
- Profit: Even if you are correct only 45% (win-rate) of the time, you can be making money. i.e You can be wrong 55% of the time and still be profitable.
